
Trade Planner Calculator
Advanced Options
Stop-Loss auto-fills as Entry ± (ATR × Multiplier) based on direction.
| Date | Symbol | Mkt | Dir | Entry | SL | TP1 | Net R:R | Risk | Position | Session | Outcome | Notes |
|---|
Free Trade Planner Calculator for Stop Loss, Take Profit and Position Size
Preparation is the key to a successful trade. This trade planner calculator helps you build a complete trade plan before entering the market. The tool goes well beyond a basic stop-loss calculator—it brings together entry price, stop loss, take profit, account risk, position size, leverage, trading costs, and journal notes in one clear, step-by-step workflow.
Instead of guessing your lot size or hoping a target makes sense, you can size your trades with precision based on actual risk numbers. The tool will provide your risk in money, your potential reward, your net risk-reward ratio, and the minimum position size win rate you require to be able to break even.
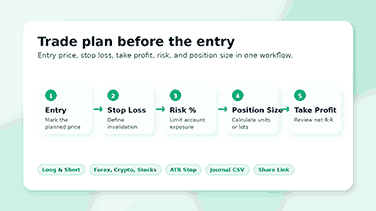
Plan Every Trade Before You Enter The Market
That is why being prepared before the market moves matters. A trader who understands the entry point, the invalidation level, the target zone, and the exact risk will be more disciplined in acting when the price moves quickly.
With this tool, you get a structured plan before placing your order. Add your price levels, choose long or short, set your account risk, and review the numbers before emotions take over.
How This Trading Planner Calculator Works
The trade planner works as a single, clean dashboard that combines everything a trader needs before entering a position. It handles stop-loss sizing, take-profit targets, position sizing, risk-reward calculations, and cost adjustments—all in one place without switching between separate tools.
Every result depends on the inputs you provide. You can see whether the reward is worth the risk, whether trading costs are dragging on your edge, and whether the position size fits within your account rules.
Long/Short Trade Setup
Go long (buy) when your analysis suggests the price will move higher. Go short (sell) when your strategy involves profiting from a price decline. The calculator adjusts the stop loss and take profit logic based on the direction you select.
This matters more than it sounds. In a long trade, the stop loss sits below entry, and targets sit above. In a short trade, the stop loss sits above entry, and targets sit below. Getting the direction right keeps the plan valid.
Settings for take-profit and stop-loss
Before entering a trade, your entry level, stop loss, and initial profit target should already be defined. The quick R buttons let you set common targets — 1R, 1.5R, 2R, 3R, or 4R — based on your planned risk. As your strategy develops, you can also add a second take profit level with a partial close percentage for trades where you want to scale out.
Real Risk-Based Position Sizing
Size your positions according to your account risk, not your ether balance. The tool calculates trade size based on the balance of the account, risk percentage, stop distance, point value, and lot size settings.
A fixed risk model leads to equal stop-losses in markets. One trade may require a tight stop; the next trade may require a wider stop, but you can still risk the same percentage of your account on both.
Alternatively, our trading position size calculator can be used for a focused sizing-only workflow to calculate trade size from account risk, stop distance, and market type.
Net Risk-Reward After Costs
Most calculators show only the gross risk reward. This trade planner calculator can also include inputs like fee, spread, and slippage for a more realistic net R:R estimate.
The costs of one trade are small, but they can change your edge on many setups. Cost drag can help you avoid taking trades that appear promising on the chart but are actually weak due to high cost-loss executions.
The importance of stop-loss planning
A stop loss is the point at which your trade idea no longer makes sense. If you don’t have that level, a small mistake can turn into an uncontrolled loss.
The calculator will turn your stop into a number you can measure. It displays the stop distance, stop percentage, risk amount, and the trade size that matches your selected risk limit.
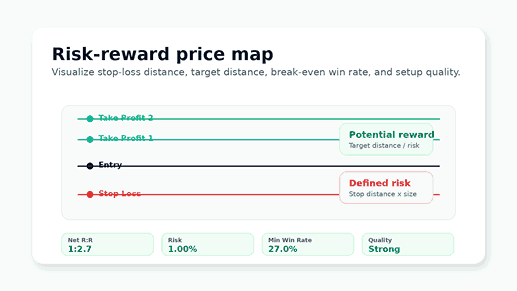
How to use the Trade Planner Calculator
Workflow is simple on desktop and mobile. Begin with the market type, include price levels, establish risk controls, and then analyze the results before executing or saving the trading plan.
Step 1: Choose Market, Direction, and Timeframe
Choose forex, crypto, stocks, indices, or commodities so the tool can apply the right defaults for that market. Select long (buy) or short (sell), then pick the timeframe that matches your setup.
Adding a symbol or pairing to your saved plans helps you keep them organized later. When you export journal data later, it’s advisable to fill in the symbol with a clear name.
Step 2: Enter Entry Price, Stop Loss and Take Profit
Please enter your planned entry, stop loss, and take profit. The calculator compares those levels with the direction you selected for the trade and warns you if the structure seems invalid.
For a long setup, the stop loss should sit below the entry and the target above it. In a short setup, the stop loss is above the entry, while the target is below.
Step 3: Set Account Balance and Risk Percentage
Enter your account balance and the risk percentage to convert the setup into a monetary risk. Many traders will use a small fixed percentage so that one trade cannot do too much damage to the account.
This is a quick step because of the risk slider. You can test different risk levels and choose the one that suits your account size, your confidence in the strategy, and the market’s volatility.
Step 4: ‘Calculate’ position size, net R:R and alerts
Click calculate to see stop distance, target distance, dollar risk, position size, margin estimate, minimum win rate, and setup rating. The visual map also shows where entry, stops, and targets are relative to each other.
Smart alerts will show common issues like inadequate R:R, high leverage, oversized risk, or a stop too close to the approximate liquidation zone.
Step 5: Add the Plan to Your Journal
After reviewing the numbers, save the setup to the local browser log. The journal saves your symbol, direction, timeframe, R:R, risk, and notes for the spreadsheet.
If you prefer to analyze trades in a spreadsheet, you can export the journal times as a CSV file. This habit makes this tool more than a one-time calculator—it builds a repeatable trading routine.
Excel Formula Generator: Traders can create formulas for risk, reward, win rate, average return, trade tracking, and other custom journal calculations.
Main formulas used in the calculator
The tool maintains simplicity, but the underlying logic is based on basic risk management mathematics. These formulas will tell you what the results say.
Risk Amount Formula
How much you are risking depends on your account size and your risk percentage. If your account has 10,000 and your risk percentage is 1%, your risk amount is 100 units of your chosen currency. That’s the most you will lose on the trade if the price hits the stop loss level as you expect.
Position Size Formula
Position size = Risk amount ÷ (Stop distance × Value per price unit). If you supply units per lot, the calculator will also convert the result into lots.
This relationship is relevant for every setup. A tighter stop loss means a larger position for the same risk amount. A wider stop requires a smaller position. The Excel Formula Builder can help traders who track results in a spreadsheet build custom formulas for risk, reward, and performance tracking.
Calculation of the Risk/Reward Ratio
The risk-reward ratio is a measure of potential reward relative to planned risk. For a long trade, reward is take profit minus entry, and risk is entry minus stop loss.
In a short trade the reward is calculated by subtracting the entry from the take profit, and the risk is calculated by subtracting the stop loss from the entry. You can also add a second take profit to the calculator, and it will change the view.
Break-Even Win Rate Formula
The break-even win rate is the break-even advantage of wins required by a strategy to break even with losses at a given R:R. If the reward is high relative to the risk, then the required win rate to break even is low.
For example, a 1:2 setup requires fewer winning trades than a 1:1 setup. The figure does not guarantee you will profit, but it can help you decide if a trading plan makes mathematical sense.
Built for Forex, Crypto, Stocks, Indices and Commodities
Every trade has an identified risk, but markets are different. The trade planner calculator provides you with flexible inputs so that you can use the same process across many asset classes.
Forex Trading Setup
Forex traders can use the tool to calculate margin requirements, lots, stop distances, and R:R sizing. Default lot size handles the standard forex sizing, and the point value settings handle the broker differences.
A typical Forex setup consists of pip distance and risk %. Check these figures before entering a position in foreign currency trading.
Cryptocurrency Trading Strategies
Crypto traders have high volatility and rapid price moves. Planning stop loss, take profit, leverage, and slippage before entry can help reduce impulsive decisions during sharp moves.
The application helps crypto traders evaluate the attractiveness of a setup after fees, spread, and slippage buffers.
Stock Trading Strategies
The tool helps stock traders work out how many shares they can buy for a given amount of risk. Same workflow for swing trades, short-term ups, and active trading plans.
Stocks can gap. News, earnings, and liquidity are still important for traders. The calculator handles the sizing, but planning and judgment remain essential for managing events that move beyond the stop level.
Index and Commodities Trading Strategies
Point value is important for tick size and tick value, as index and commodity setups tend to have bigger moves. In the advanced fields, you can set the value per price unit and the units per lot to match those of the instrument you are trading.
This flexibility allows users to use the calculator in multiple mark-specific risk processes, and they can change only the market-specific values.
Smart Features That Improve Trade Quality
A basic stop-loss calculator can give you distance, but you need more context to plan your trade better. The tool offers decision support features that allow you to assess quality before you spend your money.
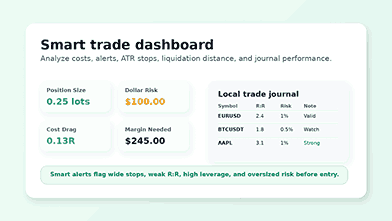
ATR-Based Stop Loss
In stop-loss mode, ATR calculates the stop level based on market volatility. The tool calculates and fills a volatility-based stop for the selected direction by using a base value and selecting a multiple.
Volatility-based stops can help traders avoid pauses that are too close to strategy or market noise. They still need a valid strategy, but they do add structure to stop placements.
2nd Take Profit & Partial Close
Some strategies will close a portion of the position at the first target and leave the rest for a bigger move. The TP2 feature measures weighted R:R to help you judge that plan better.
This feature lets you compare a simple one-target exit with a scale-out plan. The result shows whether the second target improves the overall setup or just complicates it.
Win Rate, Expectancy, and Kelly Reference
You can enter an estimated win rate, and the tool will show expectancy and a Kelly-style sizing reference based on your inputs. These values help you think in terms of long-term performance, not one isolated trade.
Treat these figures as a guide, not a rule. Conservative risk limits are still important, as win rate estimates can be wrong and aggressive sizing can increase drawdown.
Leverage and Liquidation Awareness
Leverage can magnify both gains and losses. Before using leverage, understand the risks of trading on margin. The calculator helps you estimate margin needs and gives an approximate liquidation warning so you can see when leverage can add extra danger.
The rules are different, so the estimate of liquidation is not a broker guarantee. So consider this a safety reminder and double-check the exact margin and liquidation details with your trading platform.
Copy, Share, Print and Journal Tools
It is even more powerful when you can save or share a trade plan.
- Copying a readable plan.
- Creating a share link.
- Printing the result.
- Saving your CSV entries locally.
- Download your journal as a CSV file.
These workflow features help keep your planning process consistent and repeatable. You can review the trades you planned, compare their results, and build a routine that you can repeat instead of relying on memories.
Example Trade Plan
So here’s a simple example of how the trade planner calculator takes chart levels and converts them into a measured decision.
Long Trade Example
Say a trader buys at 100, with a stop loss at 96 and a target of 112. This results in a gross risk-to-reward ratio of 1:3 before costs.
The planned risk is 50, with 5,000 accounts and a 1% risk. If each price unit has one unit of account value, the calculator will size the trade at approximately 12.5 units before converting lots.
Short Trade Example
For a simple example, consider entering at 200 with a stop-loss at 208 and a take-profit at 176. That setup risks 8 points and targets 24—again, a 1:3 gross risk-to-reward ratio.
The process mirrors the long example but runs in the opposite direction. Define the invalidation level, measure the range to target, set the account risk, and then decide whether the final numbers justify the trade.
Best Practices in Risk Management
This is a planning tool, not a substitute for discipline or a strategy filter. Use the results to filter entries and to review trades after they have been closed.
Risk Small Enough to Stay Consistent
Many traders lose consistency when one position gets too big. Using a small, fixed risk percentage per trade protects your account during losing streaks and keeps your decision-making steady. When no single trade can do serious damage, it becomes easier to follow the plan and review results without emotional interference.
The percentage depends on your strategy, account size, and experience. Conservative risk strategies often benefit beginners as they gather data and enhance their execution skills.
For long-term capital planning, an inflation calculator can help you compare account growth, purchasing power, and real value over time.
Place Your Stop Where the Setup Fails
No stop should be a random number. This level indicates where your setup fails due to market structure, volatility, or the rules of your strategy.
Once that level is identified, let the position size adjust around it—not the other way around. Moving a stop just to fit a larger position size distorts the plan and exposes the trade to unnecessary risk.
Apply a Minimum Return on Investment Filter
A minimum R:R rule is enough to avoid weak setups. Many traders look for trades with a reward that is at least 2 times the planned risk. The best ratio depends on your win rate.
The calculator displays R:R gross and net so you can assess the trade after costs. A trade that barely breaks even on fees may not be profitable when considering spreads and slippage.
Review Journal Data Often
Saved trade plans reveal patterns. You may find that one market, timeframe, risk level, or setup in the CSV file is more profitable than others.
Export the CSV file to allow yourself more room to analyze the results.
Once exported, the data can be reviewed in a spreadsheet. Use the Excel Lite Sheet to clean up duplicate rows, adjust spacing, and organize your trade history for easier pattern analysis.
Common Mistakes This Calculator Helps Avoid
The trade planner calculator helps you avoid the most common mistakes traders make before entering a position. These include trading without a defined stop, using the same lot size for every setup regardless of stop distance, ignoring spread and fees, setting targets too close to the entry, and increasing risk after a losing streak.
The calculator also catches direction errors—for example, flagging when a stop loss is placed above entry on a long trade or when a target is above entry on a short. These small mistakes can produce misleading results and lead to poorly structured trades.
Who Should Use This Trading Risk Tool
Day traders, swing traders, forex traders, crypto traders, stock traders, and index traders can use this tool to create a clearer risk plan. This interface is most suitable for traders who have a setup and want to time their entry.
It gives newer traders a clear picture of how stop distance, risk percentage, position size, and R:R work together before real money is involved. It helps experienced traders to speed up planning and to be consistent with each setup.
Why This Tool Is More Useful Than a Basic Stop Loss Calculator
The simple stop-loss calculator will usually answer one question. This tool addresses the trade planning question comprehensively. Where should the stop be placed? What is the actual risk in monetary terms? How large should the position be? What does the reward look like after fees? This tool answers all of those questions in one place.
That wider view makes the trade planner calculator valuable for real planning. And you can go from price levels to risk control and from risk control to journal review without changing tools.
Important Trading Risk Note
Trading involves risk, and losses may exceed your expectations in volatile or leveraged markets. This tool is for planning and educational purposes only. Before trading, please check your order details, contract values, fees, margin rules, and liquidation levels with your broker or exchange.
The calculator is a tool to help you plan more clearly but is not financial advice. Always trade with money you can afford to lose, and always use a risk management system that is suitable for your level of experience.
Start Planning Your Next Trade with better risk control
Try the trade planner calculator before you enter the market, not after the trade has already moved. Enter your price levels, review the risk and reward, check the numbers, and save the plan. For every setup, there is a repeatable process — and this tool makes it easier to follow it consistently.
Frequently Asked Questions
What is the Trade Planner Calculator?
A trade planner is a tool that helps traders find out their entry price, stop loss, take profit, risk, position size, and risk-reward ratio before entering a trade.
How does the calculator find position size?
This calculator is used to enter your account balance, risk percentage, stop loss distance, point value, and lot settings. The calculator then calculates the size of trade you should take for the level of risk you want.
Can I use this tool for forex and crypto?
Yes. The tool supports forex, cryptocurrency, stocks, indices, and commodities. You can also adjust the point value and lot size fields to match your specific market or broker setup.
What is a good risk-to-reward ratio?
Several traders aim for at least 1:2. A favorable ratio depends on your win rate, strategy, execution quality, and trading costs. The calculator will give you the break-even win rate to help you judge the setup.
Does the tool guarantee profit?
No trading calculator can guarantee profit. This tool helps you plan risk, size positions, and evaluate setups — but market movement, execution quality, slippage, and discipline all affect the final outcome.
Where do I put my stop loss?
Place your stop loss where the trade idea is no longer valid. You can choose that level based on market structure, support and resistance, volatility, ATR, or your test strategy’s rules.