
SPSS Lite
Rows
0
Variables
0
Numeric
0
Filled
0%
| Name | Type | Label | Measure | Decimals | Remove |
|---|
Ready for analysis
No analysis performed yet.
What SPSS Lite Does Well
SPSS Lite streamlines CSV importing, organizes variables, and lets you edit data easily. Save time as you instantly create charts and export results—all from your browser, hassle-free. Use SPSS Lite as a student, researcher, educator, or business professional to accelerate your path to actionable insights in WordPress so you focus on decisions that drive results.
Why SPSS Lite Feels Practical from the First Click
Many analysis tools are hard to start. SPSS Lite, by contrast, opens with a clear workspace and simple buttons. Its layout guides your focus. The toolbar puts import, export, and demo options up front. KPI cards quickly summarize your data.
The Data, Variables, Analyze, Visualize, and Report tabs show your next step. This design matters. Most people want a tool that is simple, easy to use, and works well on any screen.
How CSV Import Sets the Workflow in Motion
SPSS Lite makes a strong first impression. Importing CSV (comma-separated values) files is easy. You can import spreadsheet data with headers (titles at the top of columns). The parser turns these headers into stable variable names (identifiers for each column) for analysis.
The import process checks the data and uses a numeric threshold (sets a minimum amount of numeric values required to classify a column as a number) to assign variable types more accurately than treating them all as text. The tool identifies which columns are numbers or text before you open the Variables tab.
If you work with survey exports, research tables, logs, class data, or small business reports, this feature saves time and reduces manual setup.
How the Data Grid Supports Real Editing
Once your data is in, edit it directly in the grid to quickly correct, add, or remove records and keep your dataset accurate. Click any cell to change a value or search your data without leaving the page so you work efficiently.
To view more, shrink the table using the density switch. With editing and analysis in one place, you save time on post-import cleanup and avoid the trouble of switching screens.
How Variable Settings Keep the Structure Clean
The Variables view in SPSS Lite does more than just copy a spreadsheet. You can rename variables, add labels, choose data types, set measurement levels, adjust decimal places, or remove variables as needed. If you rename a variable, the tool updates the dataset for you, keeping everything consistent.
This helps you keep your workspace organized and reliable. Whether you want more detailed research, better business reports, or structured classroom examples, the Variables view is a key tool. It lets you define what your data means, not just manage the numbers.
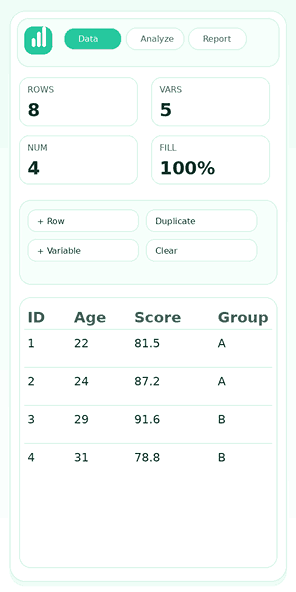
Why Dataset KPI Cards Improve Awareness
At the top of the SPSS Lite interface, you’ll see four KPI cards: row count, variable count, numeric variable count, and completeness percentage. These simple metrics let you quickly check file imports, data structure, and completeness, helping you avoid mistakes early.
The dashboard’s immediate feedback makes it easy to spot incomplete uploads, missing columns, or weak dataset structures, ensuring you don’t analyze data based on wrong assumptions.
How Descriptive Statistics Deliver Fast Understanding
Descriptive statistics quickly summarize data. SPSS Lite makes this easy. The descriptive module calculates count, mean, median, standard deviation, minimum, first and third quartiles, and maximum for chosen numeric variables.
This provides the average, spread, shape, and range in one output. Academic results, customer data, training scores, or operational numbers all benefit from this summary. You can quickly spot clustering, skewness, variability, and range.
How Frequency Analysis Organizes Categories
Not every column has numbers, and SPSS Lite handles this easily. Its frequency distribution tool counts each value, sorts the categories by count, and shows each percentage. This helps when survey answers, product types, attendance records, user groups, or task names matter more than calculations.
The frequency view shows which categories are most common, which are rare, and whether the data is balanced. SPSS Lite is effective for both numbers and identifying category patterns.
How the T-Test Helps Compare Numeric Groups
The SPSS Lite has an independent-samples t-test that lets you compare two sets of numbers. It tells you the sample sizes, averages, t-statistic, degrees of freedom, and whether or not it assumes equal variances.
The results are clear and easy to understand. You can see differences and how big they are right away. You can use this tool for school projects, basic research, checking training scores, or looking over early business results. It lets you quickly check your data before doing a more in-depth analysis.
How Correlation Reveals Relationship Strength
The best thing about SPSS Lite is that it makes correlation analysis easier for everyone to understand. SPSS Lite helps people who aren’t experts quickly understand relationships, like between age and score, spending and money earned, study time and marks, or work and output, by calculating Pearson correlations and giving them simple labels for strength and direction.
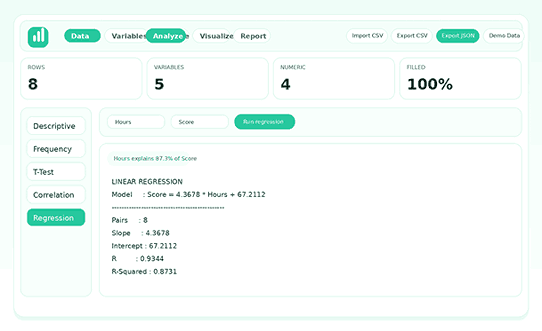
How Regression Adds a Useful Predictive Layer
The main benefit of SPSS Lite is its basic linear regression function, which shows paired counts, correlation, and R-squared values and models relationships.
These help users quickly grasp how changes in one variable can predict another. For small studies, teaching, forecasting, or early business analysis, the tool provides practical, timely insights for informed decision-making.
How Interactive Charts Make Results Easier to Read
Visualize statistical results to make them useful. SPSS Lite offers several chart types: bar, line, scatter, pie, and doughnut. Use scatter plots to show pairs of numbers. Use category-based charts to summarize counts or totals. With SPSS Lite, turn raw data into clear visuals without switching platforms.
Spot trends, find clusters, compare groups, or share straightforward summaries with people who avoid detailed reports. These features make SPSS Lite more than just a calculator.
How the Analysis Workspace Stays Focused
The Analysis tab makes your work easier by reducing confusion and saving you time. It separates choosing tests from seeing results, so you can quickly choose tests from the sidebar and focus on the options you need in the main panel.
The clear “Run” button makes it easy to move forward. Insight chips make the most important results clearer. The organized layout tells you what to do next and makes it easy to find and use each field. SPSS Lite’s focused features and design that puts analysis first help you learn, test, and feel good about your results.
.
How the Report Log Preserves Analytical History
Every analysis in SPSS Lite is saved in a timestamped log, keeping session records organized. Compare variables, test ideas, and review results easily.
No need to copy results after each step; the report log keeps everything in one place. Continue working and export the log when needed. SPSS Lite supports both ongoing and one-time projects.
How Export Options Improve Hand-offs
Exporting data makes SPSS Lite more useful by letting users keep working on their analysis and collaborating even after they close their browser. Users can view data in spreadsheets or databases when they save datasets as CSV files.
Exporting workspaces as JSON lets you share full projects, including variables, data, and reports, with other people or bring them into other systems. Saving logs as TXT keeps actions so they can be repeated, and copying reports to the clipboard makes it easy to add them to documents or presentations.
All of these options ensure users can easily move, review, and collaborate on data, giving them the most freedom outside of SPSS Lite.
How Local Autosave Protects Ongoing Work
The autosave feature in SPSS Lite keeps the tool light and stable. The app saves variables, data, and report output right in your browser’s storage. You can go back to your workspace and never lose work, even if you refresh or come back later. This feature makes the tool safer to use. It’s best to make many quick checks every day rather than doing everything at once.
Autosave aligns with the product’s dogma. SPSS Lite is still fast and focused on the front end, saving your work and respecting your time. That’s an important feature for browser-based tools, not just a nice-to-have.
How Demo Data Shortens the Learning Curve
There is demo data in SPSS Lite to help people get started quickly. The sample dataset shows you how the interface works with variables, numbers, group labels, and analysis options. This is helpful for people new to the system who want to try out the workflow before using their own data. It also helps teachers, trainers, and site owners who want to show the tool without first making a sample file.
A built-in example makes it easier to use the product, reduces hesitation, and lets users try out features such as charts, descriptive statistics, correlation, and regression right away. In general, demo data makes SPSS Lite easier to use and more accurate.
How Mobile Optimization Extends Real Usability
Many web tools claim to be responsive, but most don’t work well on small screens. SPSS Lite is great because it has easy-to-use tabs, movable panels, adjustable tables, and spacing that works best on mobile devices. Because of this, it’s still easy to find important features, so users can get what they need without having to deal with hard-to-understand menus.
You can use your phone or tablet to view data, modify displays, perform basic analyses, and review reports. The mobile-first design eliminates rigid desktop formats, promoting speed and clarity. SPSS Lite enables users to view results, generate instant reports, and try functions on the go. This saves time and keeps users productive away from the desk.
Where SPSS Lite Fits Student Work
This tool helps students learn statistics without making it too hard. For homework, a student can bring in class data, give variables clear names, examine descriptive statistics, compare groups, identify patterns, and share their results with others. It’s easy to learn how to use the workflow, but it still shows how real statistical analysis tools work.
Students can spend less time figuring out where to go and more time figuring out what they see because the interface is easy to read and the outputs have clear labels. Because of this, SPSS Lite is a great tool for learning statistics on your own, in a project-based way, or in a beginner’s class.
Where SPSS Lite Fits Research and Survey Work
This is a great tool for researchers and survey analysts who need something quick to get started before moving on to a bigger project. You can easily import survey data in CSV format and examine categorical fields using frequency distributions. You can also move numeric measures around using descriptive statistics, correlation checks, or simple regression.
The variable settings area helps keep data organized by giving labels and measurement options a place to be seen. SPSS Lite is a helpful tool for early-stage research, fieldwork checks, pilot studies, and writing internal reports. It makes it easy to quickly get the first layer of evidence out.
Where SPSS Lite Fits Teaching and Live Demonstration
Teaching tools work best when students keep a close eye on what they’re doing on the screen, and SPSS Lite is great at this. Teachers can quickly move from entering data to interpreting results without having to prepare, thanks to its tabbed navigation, clear output blocks, and an instant demo data button.
Trainers use a single platform to present descriptive statistics, categorical analyses, association measures, and regression. They also show that changing variable definitions can have immediate effects.
The charting area is very important because it helps students see data stories by highlighting trends. Unlike other complicated programs, SPSS Lite makes it easy to teach clearly and interestingly in both the classroom and online.
Where SPSS Lite Fits Business Reporting
Business teams often need quick confirmation instead of a full analytical platform. SPSS Lite is a good tool for analyzing small datasets, comparing metrics, summarizing counts, identifying simple relationships, and sharing results with others for discussion.
Marketing can look at the results of a campaign, training managers can look at assessment scores, operations can look at completion data, and administrators can make short summaries.
Its easy-to-use, browser-based design makes it useful for professionals who need simple analytics but lack experience with statistics. SPSS Lite makes simple analysis useful for businesses.
What Makes SPSS Lite Practical Instead of Overbuilt
This app stands out for its good balance. It offers more features than a basic data table, but it’s much simpler to use than a full statistical suite that can be complicated for simple tasks.
The tool provides enough structure for real analysis, plenty of charts for visual reading, and sufficient export logic for real handoffs. It stays quick, clear, and easy to understand all at the same time.
Finding that balance is hard, which is one reason why SPSS Lite is such a good product idea. The tool respects both speed and clarity, so you don’t have to choose between the two.
What Users Should Know About Scope and Limits
You should know exactly what SPSS Lite can do. This tool is not meant to do all of the hard statistical work; it is only meant for light analysis. This version of the t-test assumes that the conflicts are the same, and only simple linear regression is allowed.
For example, it lacks advanced diagnostics, deep inferential reporting, and large-scale collaborative data management. These limits make it clear what SPSS Lite is used for. It’s a good choice for people who want to quickly work with data, run simple statistical tests, view easy-to-read charts, and get results quickly in a browser.
How a Real SPSS Lite Workflow Unfolds
Even if you’ve never used SPSS Lite before, it’s easy to use. The layout shows you how to do each step: import your data, check the KPI cards, clean up rows, change variables, run analyses, make a chart, look over the report log, and export your results. You can always find the next step because each main step has its own place in the interface. You have one workspace where you work, and your dataset is in the middle. Each action builds on the last.
Upload the dataset and review it.
First, import a CSV file and make sure it loads correctly. SPSS Lite’s KPI cards quickly show you the number of rows, variables, numeric variables, and how complete your data is. This summary helps you confirm that the file imported properly and that your analysis can proceed. If a numeric variable is missing or a column header needs fixing, you’ll spot it right away instead of later in the process.
Tidy Up Variables Before Analysing
The Variables tab becomes the control center for accuracy once the data looks stable. A user can change the names of columns to make them easier to read, change a field from numeric to string behavior, set measurement levels, and change decimals to make the output look better. This step is important because a better variable structure will help you understand things better later. SPSS Lite rewards that discipline by making the editing process quick and easy.
Run Statistics with a Clear Purpose
Once you set your variables, go to the Analyze tab and choose the statistical method that works best for your question. You can look at the number of items in each category, compare values, look for relationships, or run a simple regression. The results are easy to read, and the insight fragment gives you a quick overview without making your workspace look messy.
You can check your results and export them whenever you’re ready.
Charting and exporting are usually the final steps. Use a bar chart to show how categories are distributed or a scatter plot to display relationships. The report log consolidates all your results. When you are done, you can download the log, export your dataset, or save everything as a JSON file. This lets you keep your work for future use.
Why SPSS Lite Stands Out as a Smart Statistical Workspace
This app is special because it has all the features you need for data entry, variable control, analysis, graphing, and exporting in one easy-to-use place. Its modern, simple design keeps things from getting cluttered and focuses on usefulness by making sure that each feature flows smoothly into the next.
For instance, importing lets you clean, which lets you analyze, which makes charts and, in the end, clear reports. This workflow, which works together, makes things go faster and takes less mental effort. Most market options are either too complicated or too simple, but SPSS Lite is the only one that strikes the right balance.
Frequently Asked Questions
Q: Is this a full SPSS replacement?
No, this app is lightweight and works directly in your browser. It’s made for quick analysis.
Q: Do I need to install anything?
You don’t have to install anything. It runs in any current browser.
Q: Is my data safe?
Your data dwells in your browser and never leaves your device.
Q: Can I import/export my files?
Yes, you can import and export files in CSV, TXT, or JSON format.